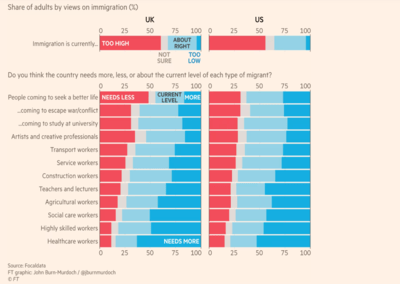
A mysterious French trader (known as Theo) used an ingeninous polling technique during the 2024 US election: rather than asking respondents who they would vote for, he asked them who they expected their neighbours to vote for. This indirect method revealed support for Kamala Harris to be lower than people thought, and Theo was so confident in a Trump win that he bet $30 million on it (a very smart move).
Polling
Germanty election
Say you wanted to gauge the impact of a brand’s ethics on purchase decisions. The most basic approach is to ask directly, out of context and in isolation. And it turns out that when you simply ask consumers if a brand’s ethics are important, the vast majority agree they are. But this finding is at odds with how people behave. Shein & Amazon are incredibly popular retailers, despite their questionable approach to sustainability and taxation. And few people can actually name a specific brand whose ethics they admire.
A single word can make a policy significantly less appealing. According to pollster Frank Luntz, 68% of Americans oppose inheritance tax when it is labelled ‘estate tax’, but 78% opposite it labelled as ‘death tax’.
Demographics are useful when used correctly, but they’re often too vague to be meaningful. A simple ethnic minority grouping misses key nuances in the political sphere, like the fact Chinese voters are significantly more likely than Bangladeshi voters to value low taxes.
Not all labels are positive. Only 19% of the public identify themselves as feminists, but 81% believe women should be treated as equal in every way.
It’s not new to say generations are misleading, but voting behaviour makes it clear to see: in the 2024 US election, Kamala Harris’s winning margin declined by 23 points among 18-24 year olds but only 3 points among 25-29 year olds. Technically, these age groups are both part of Gen Z.
60% of Americans think the government is spending too much. But what exactly is the government spending too much on? Not social security: 62% think the government spends too little on that, versus 7% who think it spends too much. Not Medicare (58% want more spending, 10% want less). Not healthcare (63% want more spending). Not education (65% want more). This is the danger of relying on general wording when the devil is in the detail.
Pollster Frank Luntz tested three different ways of describing changes to Medicare spend.
1) Increase from $178 billion to $250 billion over six years (the “billions to billions” approach).
2) Increase by 6.4% a year, every year, for six years (the “year over year” strategy).
3) Increase from $4,700 per person per year to $6,200 per person per year (the “personalised” approach).
Mathematically they’re all the same, but in practice the third option was by far the most popular – people want to understand the individual benefit from government policies.
We still don’t know how many homes are built in the UK each year. Housing data has historically come from the National Housebuilding Council (NHBC) – an organisation established to provide warranties on new homes. But NHBC’s market share has deteriorated in the last few years – from 85% to 60% – which means a significant proportion of homes aren’t counted. By compring to other records, like council tax, it’s estimated that half of new homes in London were missed in 2023.
The 2011 UK census showed that a whopping 58% of residents in England identified as English only. Skip forward a decade and this number plunged to 15%. Was this a significant decline in nationalism? No, a botched survey. In 2011 “English” was the first option and “British” was the fifth; in 2021 “Britain” came top of the list.
When asked in general terms, most people say that immigration is too high and the government is spending too much money. But the story is more nuanced when it relates to specific examples: the public actually wants more migrants who are highly skilled or in social work. We can’t expect to understand complex topics with generic prompts.
To calculate inflation, the ONS uses a typical basket of goods to work out the rate at which the cost of goods and services are rising – but the selection is inherently subjective. For instance.
NPS is a simple way of gauging customer experience, but don’t confuse that with a measure of growth: studies consistently show that NPS changes don’t predict market share.
The Physical Activity and Fitness Survey asks people how much exercise they do, and measures (with accelerometers) how much they actually do. Unsurprisingly, the two figures don’t match up.
